
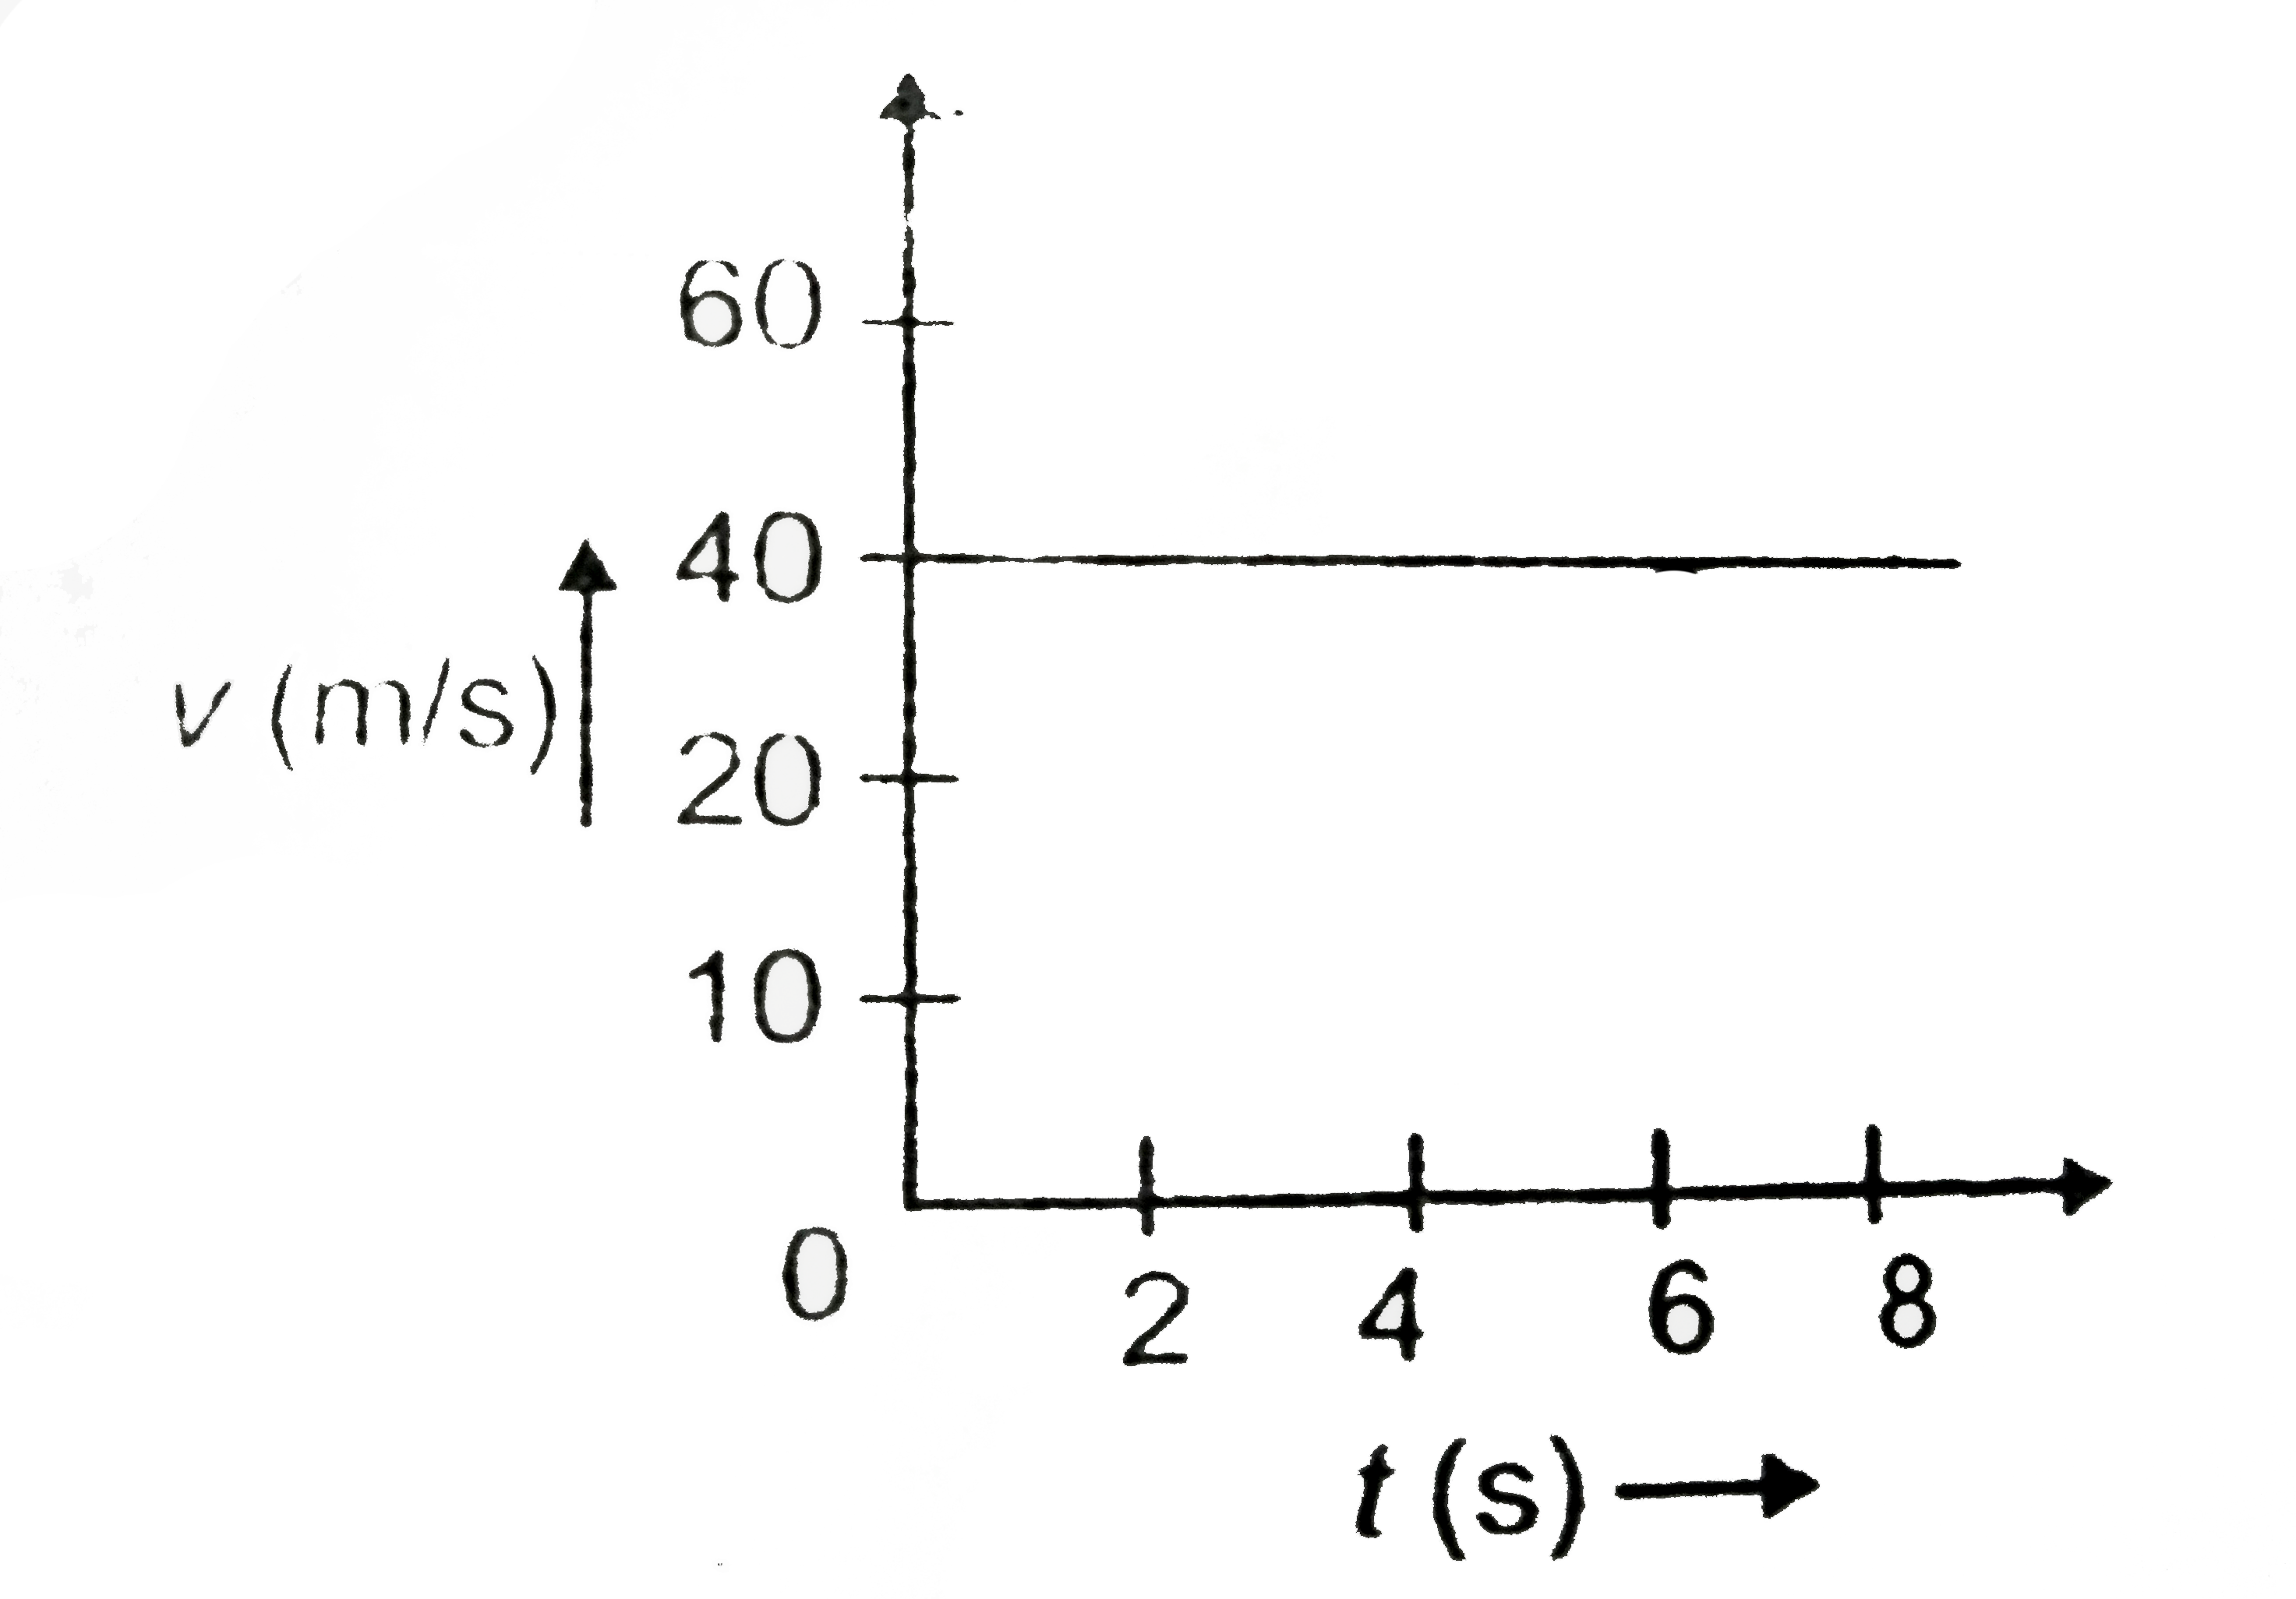
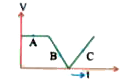
the velcoity - time graph for a vehicle is shown if fig 3.24. drow acceleration - time graph from it .
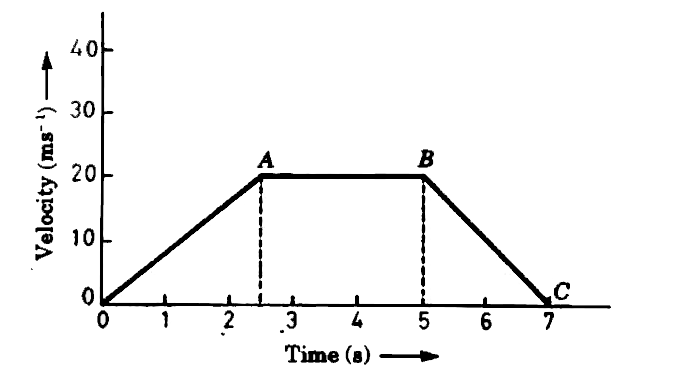
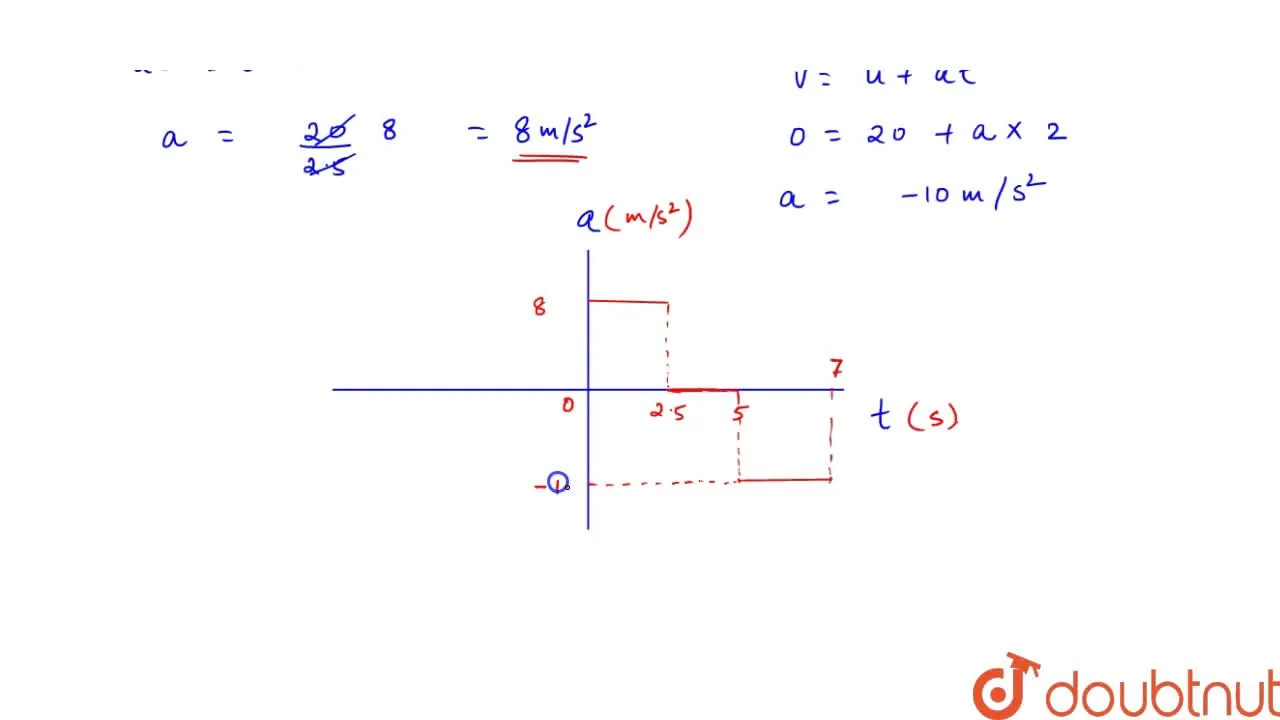

Step by step video & image solution for the velcoity - time graph for a vehicle is shown if fig 3.24. drow acceleration - time graph from it . by Physics experts to help you in doubts & scoring excellent marks in Class 11 exams.
Similar Questions
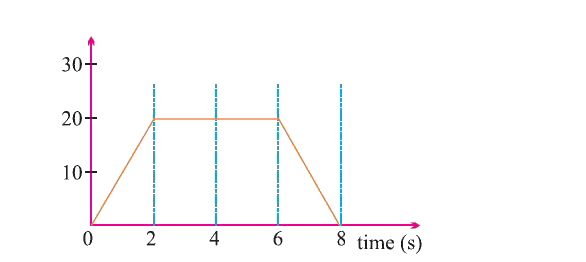
The velocity time graph for a particle is shown in figure. Draw acceleration time graph from it.
 View Solution
The velocity - time graph of a body is given in figure below .
The acceleration-time graph of the motion of the body isView SolutionThe velocity-time graph of an object is shown below. The acceleration of the object is
 View Solution
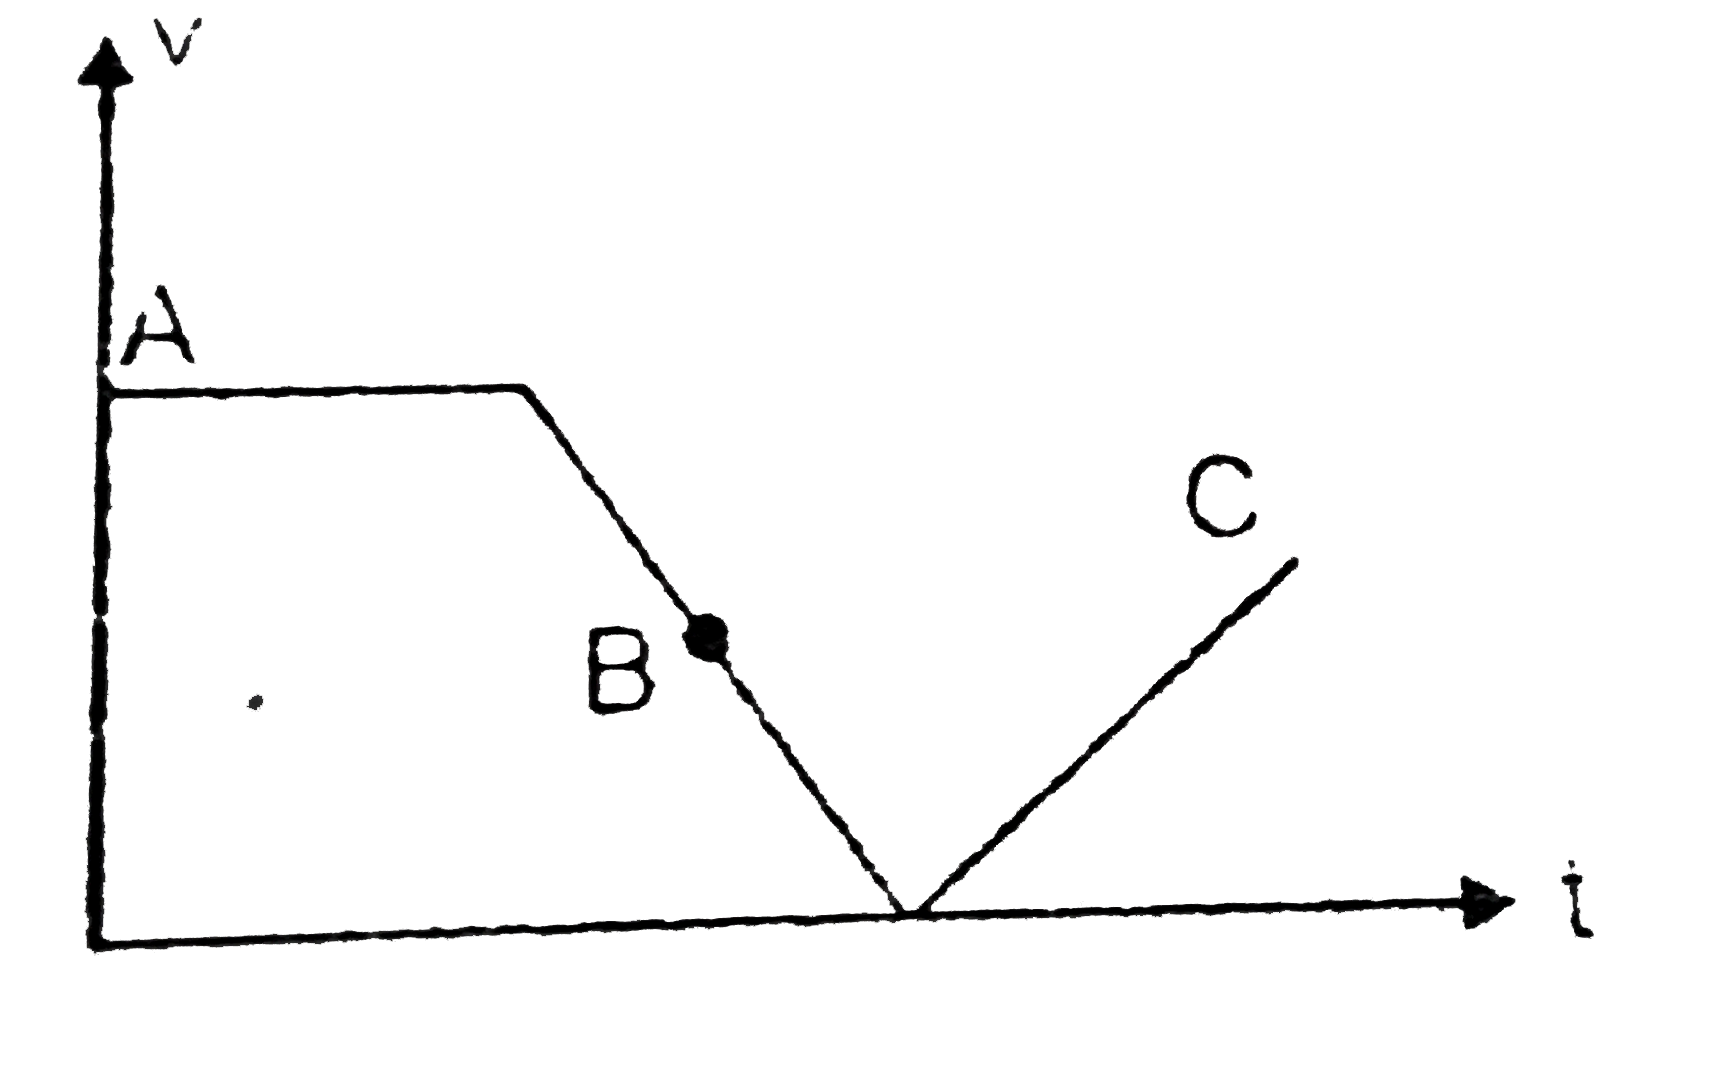
The velocity time graph of a body is shown in fig. it indicates that :
 View Solution
The area under acceleration-time graph gives
View SolutionThe distance-time graph of a moving vehicle is as shown in the figure.
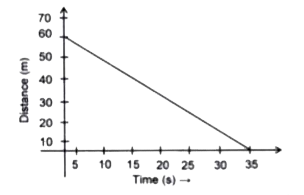 View Solution
The area under acceleration - time graph represents the
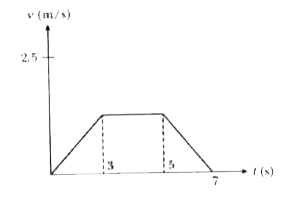
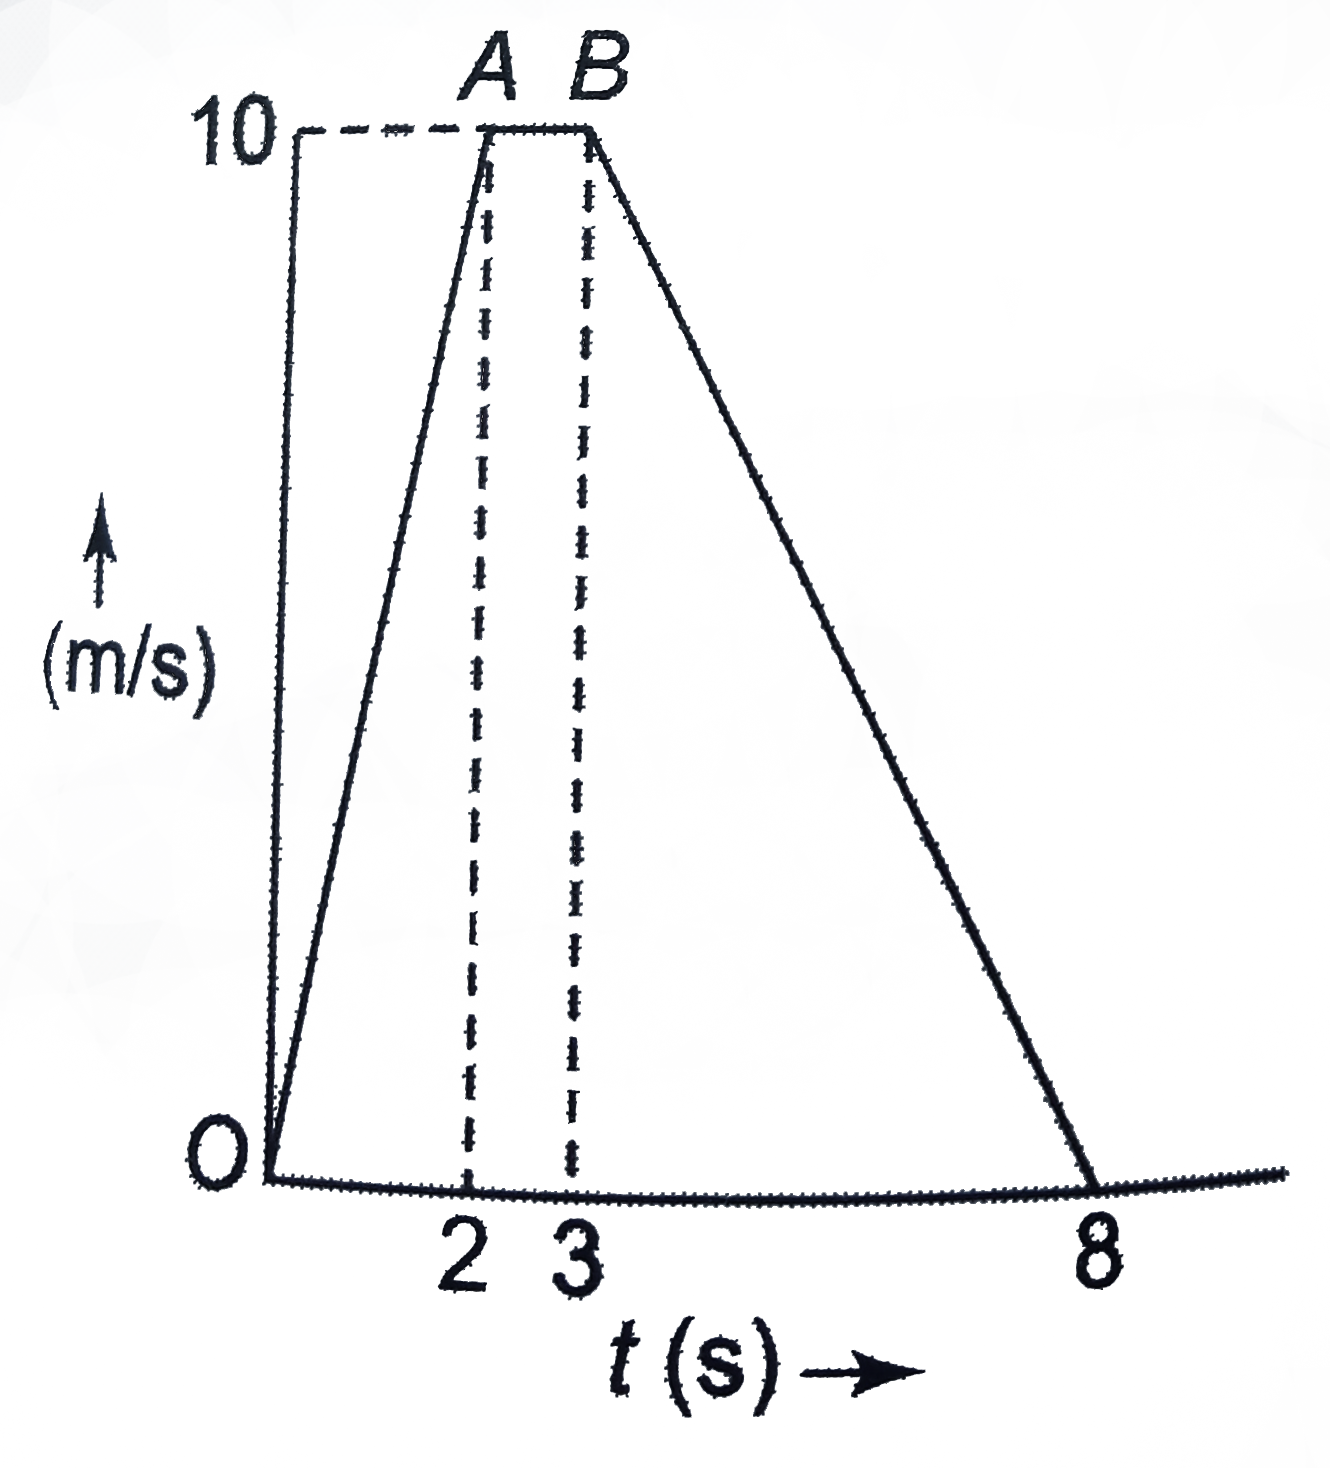
View SolutionFor a particle moving in a straight line, the velocity-time graph is as shown in the figure. Find the acceleration at time t=1s2.5s and 5s. Sketch the acceleration time graph.
 View Solution
The veloctiy - time graph of a body is shown in the fig. It implies that at point B.
 View Solution
The velocity - time graph is shown in the figure, for a particle. The acceleration of particle is
 View Solution