
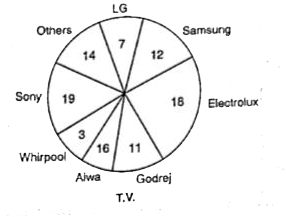
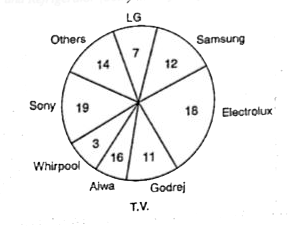
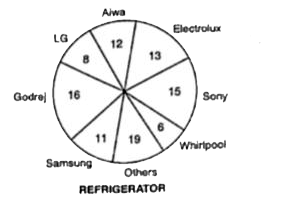
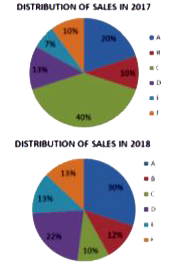
The two pie charts show the market share of different companies which produces TV and Refrigerator (noth) in the first quarter of 2005-06.
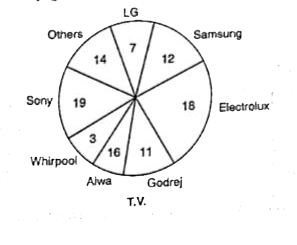
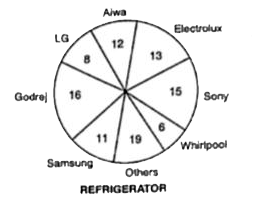
Which of the following cann't be deduced from the given data :
The angular difference between Samsung TV and Electrolux refrigerator is 3.6∘.
Sony is the market leader in the TV and Refrigerator segment combined.
For every Rs. 100 turnover of Whirlpool Refrigerator, the difference in the turnover of Electrolux and Samsung Refrigerator is Rs. 33.34 crore
none of the above

The correct Answer is:B
Step by step video, text & image solution for The two pie charts show the market share of different companies which produces TV and Refrigerator (noth) in the first quarter of 2005-06. Which of the following cann't be deduced from the given data : by Maths experts to help you in doubts & scoring excellent marks in Class 14 exams.
Related Playlists
Knowledge Check
- Question 1 - Select One
The two pie charts show the market share of different companies which produces TV and Refrigerator (noth) in the first quarter of 2005-06.
Which of the following cann't be deduced from the given data :AThe angular difference between Samsung TV and Electrolux refrigerator is 3.6∘.BSony is the market leader in the TV and Refrigerator segment combined.CFor every ₹100 turnover of Whirlpool Refrigerator, the difference in the turnover of Electrolux and Samsung Refrigerator is ₹33.34 crore.Dnone of the above - Question 1 - Select One
The two pie charts show the market share of different companies which produces TV and Refrigerator (noth) in the first quarter of 2005-06.
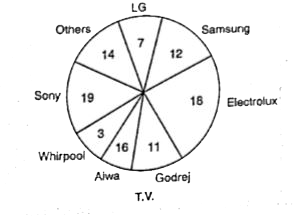
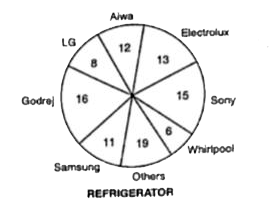
The difference is not shown to scale.A7.2∘B14.4∘C21.6∘Dnone of these - Question 1 - Select One
The two pie charts show the market share of different companies which produces TV and Refrigerator (noth) in the first quarter of 2005-06.

If the turnover in the first quarter of 2005-06 of Electrolux TV and Refrigerator is RS. 42 crores and Rs. 6 crores respectively, then what is the average annual turnover of Godrej and Aiwa in both the product categories together ?ARs. 304 croresBRs. 284 croresCRs. 178 croresDnone of these - Question 1 - Select One
The two pie charts show the market share of different companies which produces TV and Refrigerator (noth) in the first quarter of 2005-06.
If the turn over of Samsung TV is Rs. 31 crores and of Samsung refrigerator is Rs. 9 crore, then what is the overall market share of electrolux TV and refrigerator combined ?A0.3333B0.28C16.7%D0.65 - Question 1 - Select One
Production of steel in different companies in three consecutive years (in lakh tonnes)
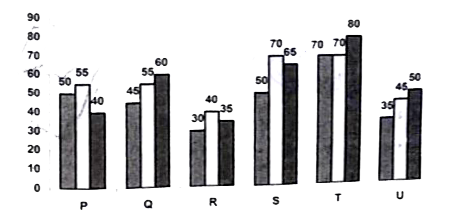
Which of the following companies recorded the minimum growth% from 2004 to 2005?APBQCRDS - Question 1 - Select One
Study the following graph carefully to answer the questions that follows
Production of Alluminium by different companies in three consecutive years (in lakh tonne)
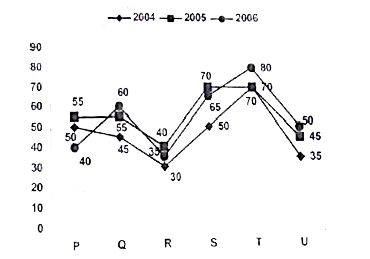
Which of the following companies recorded the minimum percentage growth from 2004 to 2005?APBQCRDS
Similar Questions
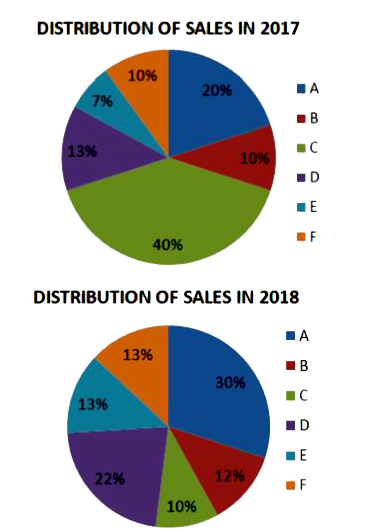
The pie charts show the market share of the companies in the detergent market in 2017 and 2018. The total size of the market has decreased from ₹ 300 crores to ₹ 200 crores. What is the decrease in the sales of Company F?
 View Solution
The pie charts show the market share of the companies in the detergent market in 2017 and 2018. The total size of the market has decreased from Rs. 300 crores to Rs. 200 crores. What is the decrease in the sales of Company F ?
 View Solution
Students of a class voted for their favourite colour and a pie chart was prepared based on the data collected.
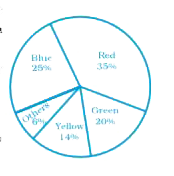
Observe the pie chart given below and answer questions based on it.
Which of the following is a reasonable conclusion for the given data?View SolutionThe pie chart given shows the number of marks scored by a student in the given 5 subjects. The total marks scored by the student is 480.
In which of the following 2 subjects the sum of marks scored by the student is equal to the marks scored in Mathematics?View Solution