
The graph given below shows the effect of substrate concentration on the rate of reaction of the enzyme green-gram-phosphatase What does the graph indicates?
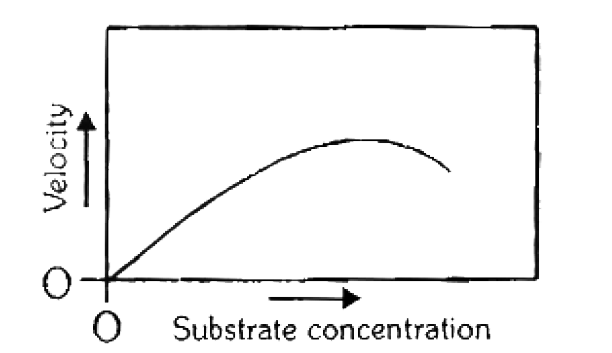
The rate of enzyme reaction is directly proportional to the substrate concentration.
Presence of an enzyme inhibitor in the reaction mixture
Formation of an enzyme substrate complex
At higher substrate concentration the pH increases

The correct Answer is:D
Step by step video & image solution for The graph given below shows the effect of substrate concentration on the rate of reaction of the enzyme green-gram-phosphatase What does the graph indicates? by Biology experts to help you in doubts & scoring excellent marks in Class 12 exams.
Related Playlists
- BOOK - MOTIONCHAPTER - RESPIRATION IN PLANTS EXERCISE - EXERCISE - 327videos
RESPIRATION IN PLANTS
- BOOK - MOTIONCHAPTER - RESPIRATION IN PLANTS EXERCISE - EXERCISE - 419videos
RESPIRATION IN PLANTS
- BOOK - MOTIONCHAPTER - RESPIRATION IN PLANTS EXERCISE - EXERCISE -180videos
RESPIRATION IN PLANTS
- BOOK - MOTIONCHAPTER - REPRODUCTIVE HEALTHEXERCISE - Exercise - 43videos
REPRODUCTIVE HEALTH
- BOOK - MOTIONCHAPTER - SENSORY ORGANSEXERCISE - EXERCISE - 321videos
SENSORY ORGANS
Knowledge Check
- Question 1 - Select One
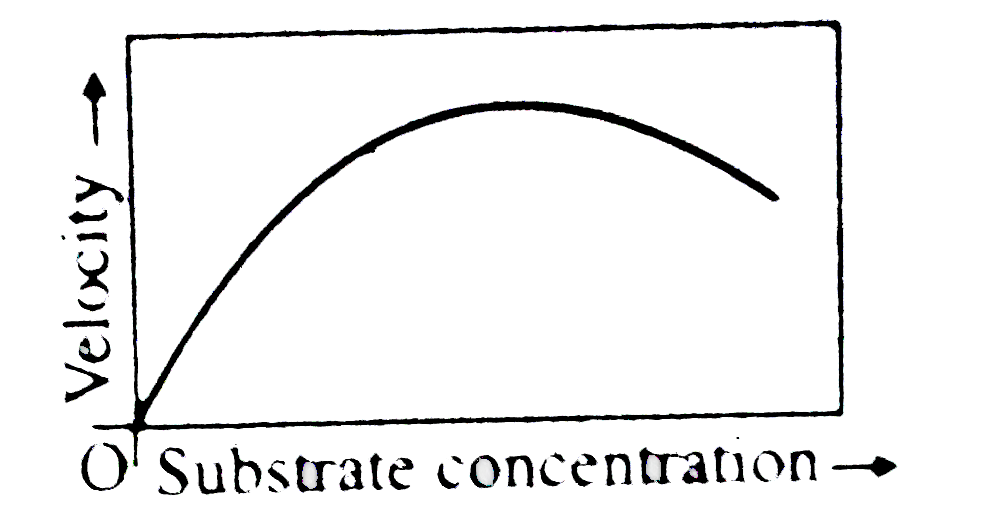
The given graph shows the effect of substrate concentration on the rate of reaction of the enzyme green-gram-phosphatase What does the graph indicate?
AThe rate of enzyme reaction is directly proportional to the substrate concentrationBPresence ofan enzyme inhibitor in the reaction mixtureCFormation of an enzyme-substrate complexDat higher substrate concentration the pH increases. - Question 1 - Select One
The given graph shows the effect of substrate concentration on the rate of reaction of the enzyme green gram-phosphatase

What dose the graph indicateAThe rate of enzyme reaction is directly proportional to the substrate concentrationBPresence of an enzyme inhibitor in the reaction mixtureCFormation of an enzyme-substrate complexDAt higher substrate concentration the pH increase - Question 1 - Select One
The given graph shows the effect of substrate concentration on the rate of reaction of the enzymes green gram-phosphatase. What does the graph indicate ?
 AThe rate of enzyme reaction is directly proportional to the substrate concentration.BPressence of an enzyme inhibitor in the reaction mixture.CFormation of an enzyme-substrate complex.DAt higher substrate concentration the pH increase.
 - Question 1 - Select One
the graph given in Fig.9.36 shows the effect of substrate concentration on the rate of reaction of the enzyme green-gram -phosphatase . What does the graph indicates ?
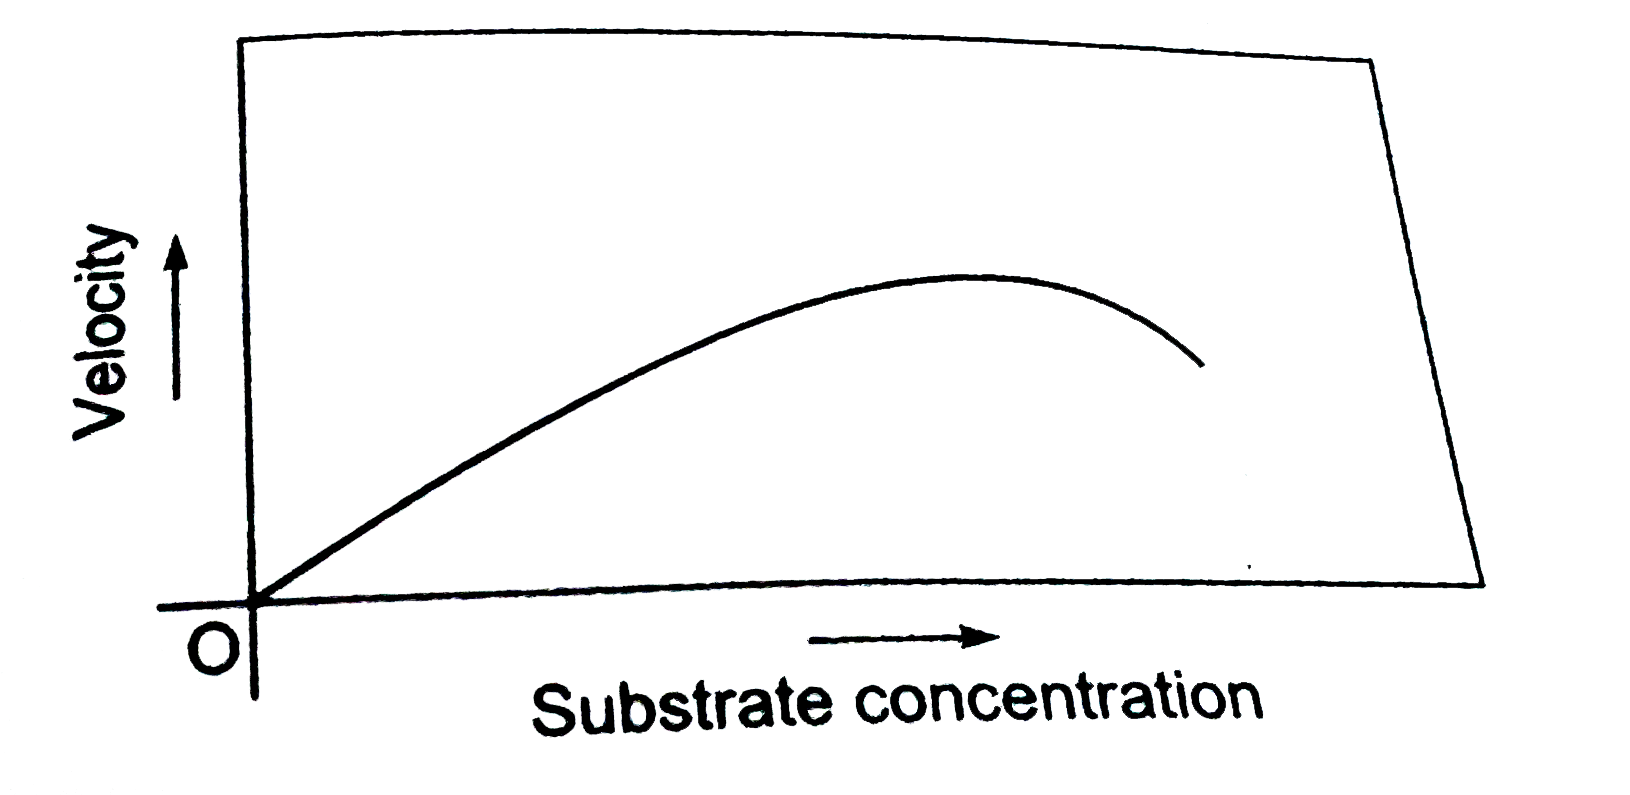 Athe rate of enzyme reaction is directly proportional to the substrate concentrationBPresence of an enzyme inhibitor in the reaction mixture .CFormation of an anzyme-substrate complex.DAt higher substrate concentration , the pH increases H+cone⏐↓
 - Question 1 - Select One
Figure given below shows three velocity-substrate concentration curves for an enzyme reaxtion. What do the curves for an enzyme reaction. What do the curves depict
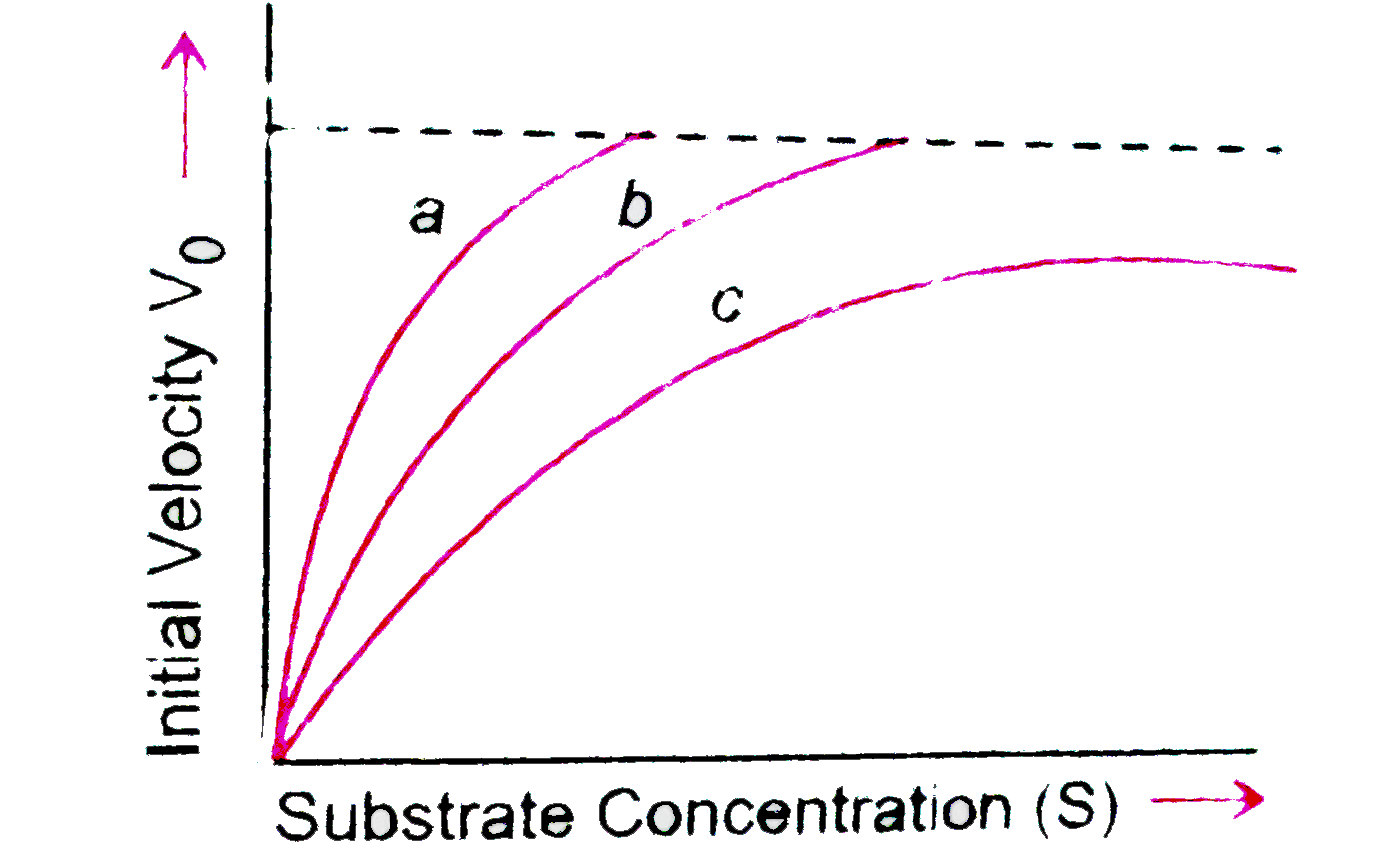 Aa-normal enzymes action, b-competitive inhibition,c-noncompetitive inhibitionBa-enzyme with an allosteric modulator added, b-normal enzyme activity, c-competitive inhibitionCa-enzyme with an allosteric stimulator,b-competitive inhibition added, c-normal enzyme reactionDa-normal enzyme reaction, b-non-competitive enhibition added c-allosteric inhibitor add.
 - Question 1 - Select One
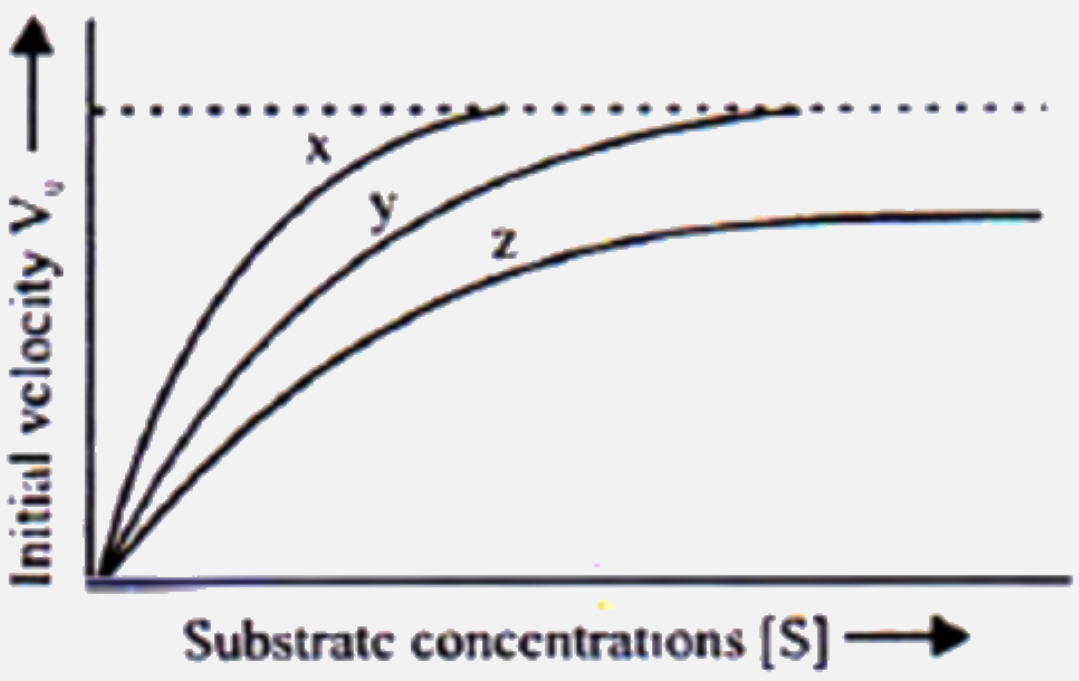
The given figure shows three velocity-substrate concentration curves for an enzyme reaction. What do the curves x, y and z depict respectively?
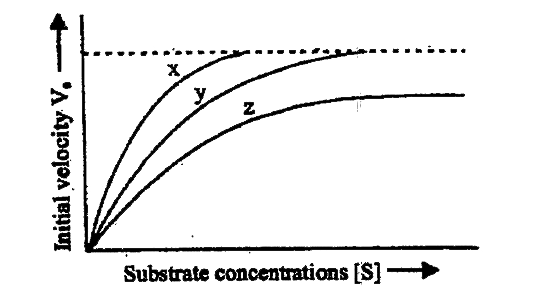 Ax-normal enzyme reaction, y-competitive inhibition, z-non-competitive inhibitionBx-enzyme with an allosteric modulator added, y-normal enzyme activity, 2-competitive inhibitionCX-enzyme with an allosteric stimulator, y-competitive inhibition added z-normal enzyme reactionDx-normal enzyme reaction, y-non-competitive inhibitor added z-allosteric inhibitor added
 - Question 1 - Select One
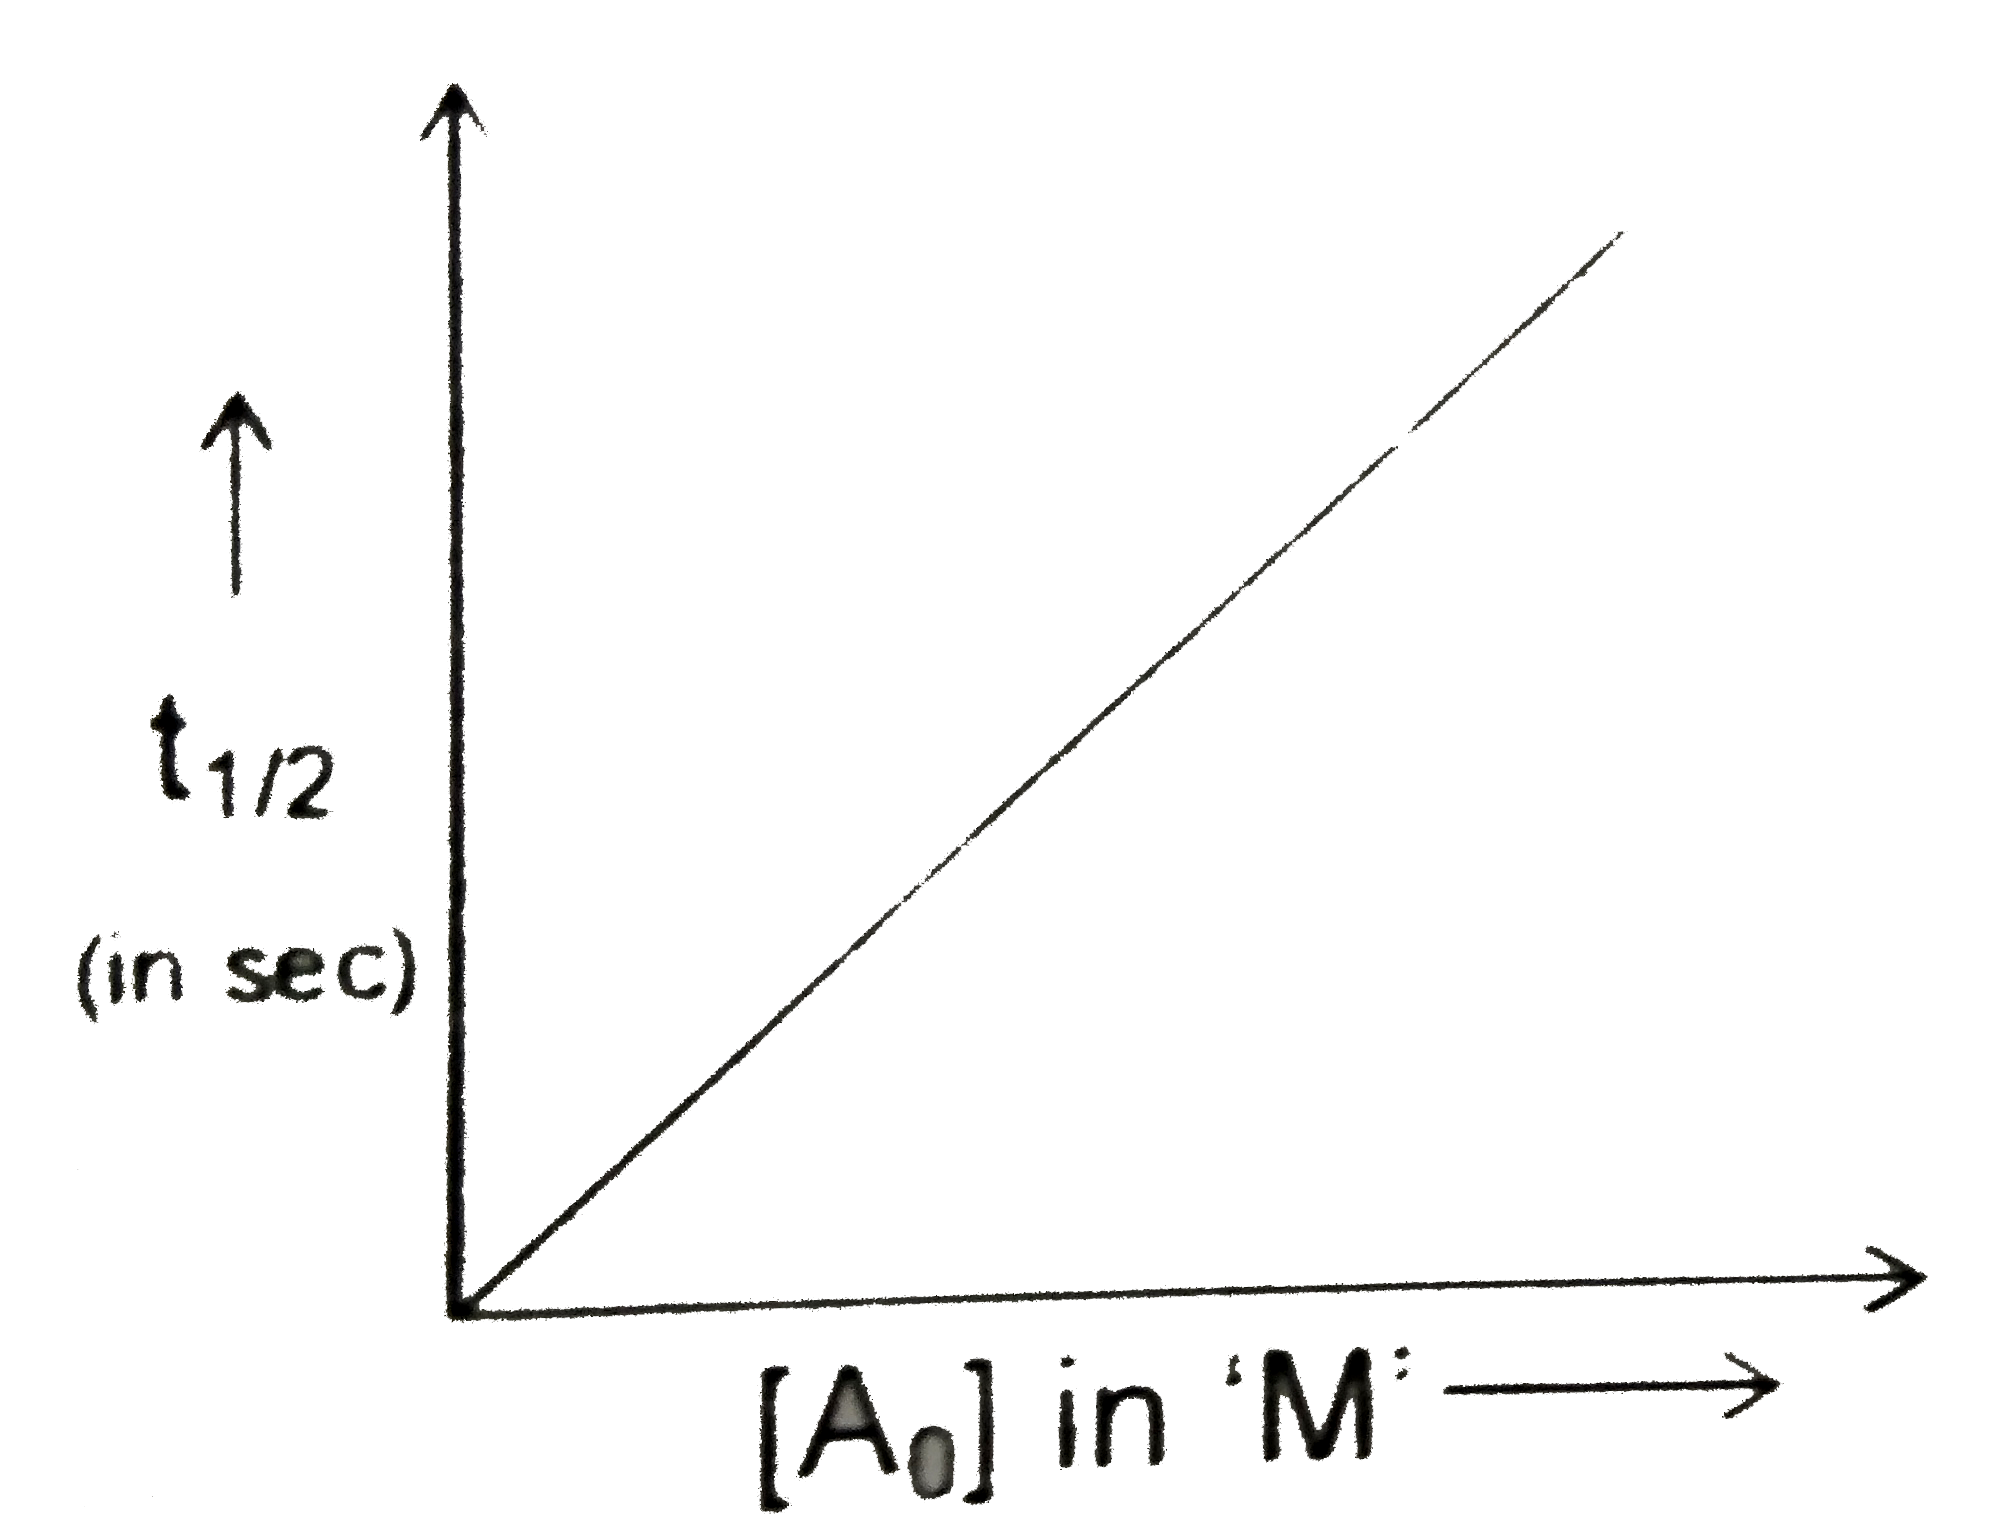
What is the unit of rate constant of the reaction for which the above graph is given?As−1BmolL−1s−1CmolL−1sDmol−1L2s−1
Similar Questions
What does the given reaction show ?
View SolutionThe Given figure shows three velocity-substrate concentration curves of an enzyme reaction. What do the curves X Y and Z depict respectively ?
 View Solution
Which one of the given graphs shows the effect of temperature on the velocity of a typical enzymatic reaction ?
View Solution